

HydroVision
Abstract
Abstract
Introduction
Flood forecasting is a critical area of study aimed at predicting river flow levels, flood stages, and other hydrological conditions that could lead to potential flooding. Flooding is a natural disaster with severe consequences, including the loss of lives, damage to property and infrastructure, and adverse impacts on ecosystems. Accurate flood forecasting can mitigate these impacts by providing timely warnings, allowing for preventive measures, and aiding in the optimal management of water resources. With climate change causing an increase in the frequency and intensity of extreme weather events, there is an ever-growing need for reliable flood forecasting systems to safeguard vulnerable communities and infrastructures.
Study Area
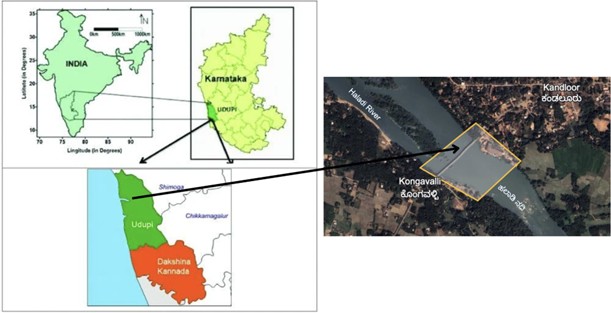
Varahi River basin, located near Kandlur in Kundapura Taluk of Udupi District, Karnataka, India, serves as the study area for this flood prediction project. Situated between latitudes 13.624°N to 13.67°N and longitudes 74.774°E to 74.8°E, and having a total area of 1,14,125.92sq.m. and perimeter of 1376.1m, this region experiences a tropical monsoon climate, with significant rainfall from June to September due to the southwest monsoon winds.
The Western Ghats, which flank the river basin, significantly influence the region’s hydrological dynamics. The combination of high-intensity rainfall and steep terrain results in high runoff rates, which often lead to river swelling and flooding in low-lying areas. Flooding in the Varahi River basin is a recurring issue, affecting local communities, agriculture, and infrastructure.
The population around the riverbanks, particularly in the village of Kandlur, faces heightened vulnerability due to their proximity to the river and dependence on it for agriculture and daily water needs. With the increasing frequency and intensity of extreme weather events driven by climate change, the necessity for a robust flood prediction model tailored to the unique characteristics of this area has grown urgent.
Methodology
Datasets for Flood Forecasting
The project utilizes historical climate and hydrological data (1992–2020) from ERA5 and GloFAS datasets to develop a flood forecasting model for the Varahi River.
Feature Variables (ERA5 Dataset):
Sourced from the Copernicus Climate Data Store, ERA5 provides daily atmospheric, land, and sea variables. Key variables include:
Meteorological: Dew point temperature (d2m), runoff (ro), convective (cp) and large-scale precipitation (lsp), total column water vapor (tcwv)
Hydrological: Soil moisture at two depths (swvl1, swvl2)
Topographical: Geopotential height (z), land-sea mask (lsm), slope (slor)
Time-based and metadata: valid_time, number, expver, soil type (slt)
Target Variable (GloFAS Dataset):
The primary target is daily river discharge (dis24), measured in m³/s, representing the river flow volume.
Data Processing:
Both datasets were converted from NetCDF to CSV for analysis. Preprocessing included handling missing values, standardizing units, and engineering features such as lag values and seasonal indicators.
Machine Learning Approaches
Three predictive modeling approaches were implemented, each increasing in complexity and predictive capability:
Approach 1: Standalone XGBoost Model
Features include lagged discharge values and temporal indicators.
Hyperparameters tuned via RandomizedSearchCV.
Evaluated using MAE, RMSE, and NRMSE.
Approach 2: XGBoost + LightGBM Voting Ensemble
Combines predictions from independently tuned XGBoost and LightGBM models.
Uses Voting Regressor for ensemble averaging.
Enhanced feature engineering with cyclic temporal transformations.
Approach 3: Stacking Ensemble (XGBoost + LightGBM → Ridge Regression)
Hyperparameter tuning via Optuna.
Ridge Regression as meta-model learns optimal weighting of base model predictions.
Expected to deliver highest accuracy through sophisticated model stacking.
Each approach builds on the previous, aiming to enhance model robustness and flood prediction accuracy.
Observations and Results
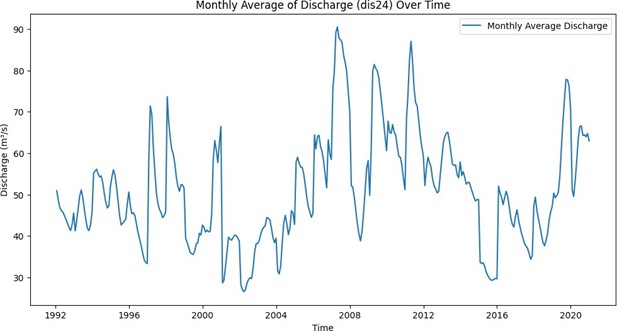
Fig: Mean daily river discharge over time (checking for seasonality trends)
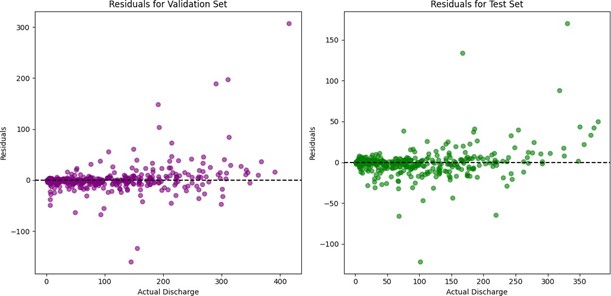
Model 3
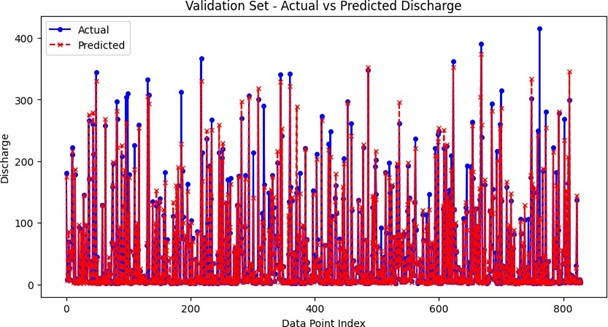
Fig: Predicted vs. Actual Discharge values on Validation Set
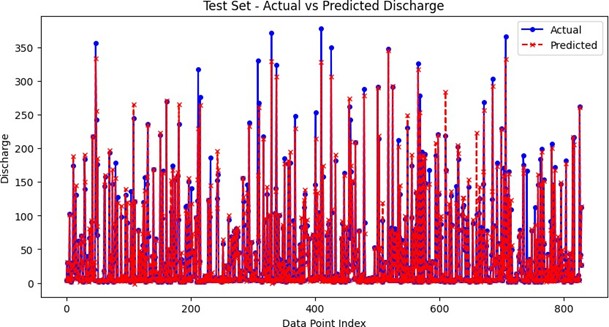
Fig: Predicted vs. Actual Discharge values on Test Set
Report Information
Team Members
Team Members
Report Details
Created: April 7, 2025, 6:42 p.m.
Approved by: Nikesh Shetty [Piston]
Approval date: April 23, 2025, 10:30 p.m.
Report Details
Created: April 7, 2025, 6:42 p.m.
Approved by: Nikesh Shetty [Piston]
Approval date: April 23, 2025, 10:30 p.m.